 | Products |
| Home » Technical Support » Elevate Web Builder Technical Support » Product Manuals » Elevate Web Builder 3 Manual » Using the IDE » Running and Debugging a Project |
It is possible to run both client applications and server applications directly in the IDE for testing purposes. For client applications, the IDE uses an embedded version of the Internet Explorer web browser to run the application.
 The IDE requires that Internet Explorer 11 or higher be installed in order to properly run applications in the IDE.
For server applications, the IDE uses a request selected from the requests defined in the Request Manager in the IDE. Please see the Using the Request Manager topic for more information on defining requests to use when running server applications in the IDE.
Server applications can be debugged while they are being run in the IDE, but not client applications. Once Internet Explorer 11 is replaced with an embedded version of Microsoft Edge in a future release, debugging functionality for client applications will also be made available in the IDE.
Use the following steps to run a project:
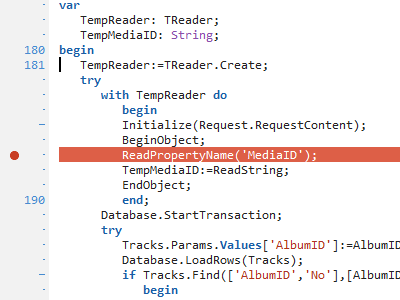
Both before and while running a server application in the IDE, you can define source unit breakpoints so that the application execute will pause when it hits such a breakpoint. Breakpoints can be added by clicking to the left of the line numbers in the gutter area of the code editor:
You can also toggle a breakpoint for the current line in the code editor by pressing the F5 key.
Once a breakpoint has been set, it is added to the breakpoints:
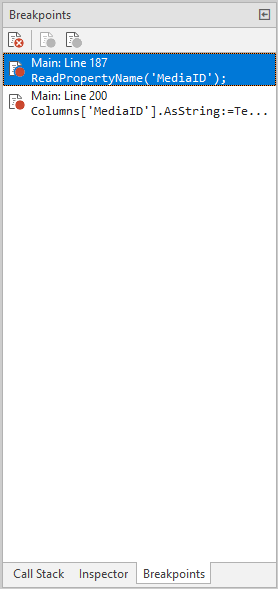
You can navigate to a breakpoint by double-clicking on the breakpoint or by pressing the Enter key when the breakpoint is selected. In order to delete, enable, or disable a given breakpoint, you can use the breakpoints toolbar or you can right-click on the breakpoint and select the desired option from the context menu. You can also delete a breakpoint by selecting the breakpoint and pressing the Del key.
Disabling a breakpoint simply prevents it from pausing the execution of the application, whereas deleting a breakpoint removes the breakpoint completely.
Once a server application has been successfully started on the run server, the interactive debugging functionality will become active in the IDE. If any breakpoints were set in the source units for the project, these breakpoints will be updated to reflect whether they are valid for the compiled application present on the run server. If any valid breakpoints are encountered while the application is being executed on the run server, the application execution will pause and various debugger command buttons will be enabled.
Debugger Commands
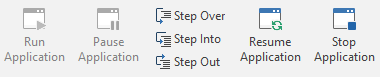
Click on the Step Over button to step over the current source unit line being executed, even if the line contains a function or procedure call. You can also use the keyboard to step over a source unit line by pressing the F8 key.
Click on the Step Into button to step over the current source unit line being executed if the line does not contain a function or procedure call, or step into the corresponding function or procedure if the line does contain such a call. The debugger will step into the first call followed by any other calls on the same line, from left to right. You can also use the keyboard to step over a source unit line by pressing the F7 key.
Click on the Step Out button to step out of the current procedure or function body. You can also use the keyboard to step out of a procedure or function body by holding down the Shift key and pressing the F7 key.
Click on the Resume Application button to resume execution of the application. The application execution will then continue until it either hits another breakpoint, is stopped, or completes. You can also use the keyboard to resume execution by pressing the F9 key.
Click on the Stop Application button to stop the execution of the application. You can also use the keyboard to stop the execution by holding down the Ctrl key and pressing the F2 key.
Whenever the execution of the application is paused, you will also see two new tabs appear in the Tools area of the IDE: the call stack and the local variable inspector.
Call Stack
The call stack will show all of the calls that preceded the current breakpoint, in the reverse order of when the call was executed:
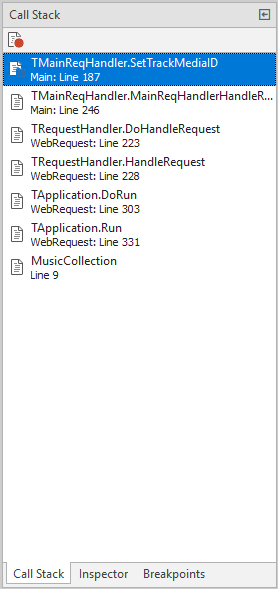
The call stack allows you to navigate to a call by double-clicking on the call or by pressing the Enter key when the call is selected. In order to toggle a breakpoint for a given call, you can use the call stack toolbar or you can right-click on the call and select the Toggle Breakpoint option from the context menu.
Local Variable Inspector
The local variable inspector allows you to examine the value of any local variables, including the properties of class instances.
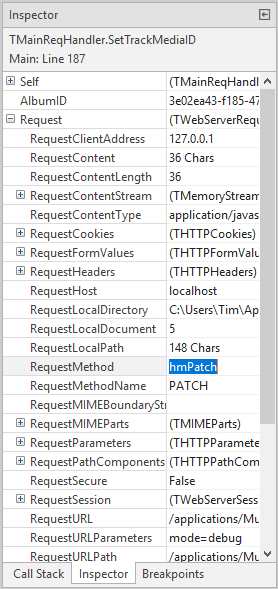
For any variables or properties that use special dialogs for displaying the contained value, you will see a "..." button next to the property or variable. Clicking on this button will launch the dialog.
For server applications, the IDE uses a request selected from the requests defined in the Request Manager in the IDE. Please see the Using the Request Manager topic for more information on defining requests to use when running server applications in the IDE.
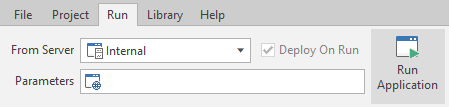
Use the following steps to run a project:
- Click on the Run tab on the main menu.
- For client applications, select the run server from the list of available servers, select whether or not to automatically deploy the application before running it, and modify the run parameters as necessary.
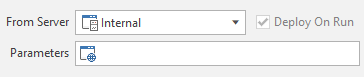
The Internal web server built into the IDE always uses automatic deployment of an application.
Parameters are specified in the following format:
?param1=paramvalue1¶m2=paramvalue2¶m3=paramvalue3
You can also specify an anchor to be used with the URL used to run the application:
#anchor1
If specifying both parameters and an anchor, the anchor should be placed after the parameters.
The complete target URL that the IDE uses to run a client application is determined by the base URL for the run server, the deployment path for the project, and the specified parameters:
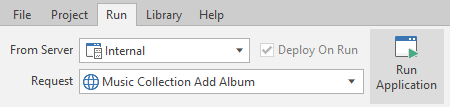
- For server applications, select the run server from the list of available servers, select whether or not to automatically deploy the application before running it, and select the request to use for running the application.
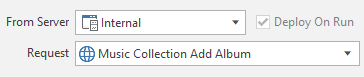
The Internal web server built into the IDE always uses automatic deployment of an application. Also, the complete definition of the HTTP request used to run the server application is contained within the selected request. Please see the Using the Request Manager topic for more information on defining requests to use when running server applications in the IDE. - Click on the Run Application button on the Run menu to run the current project. If necessary, the IDE will automatically build the application before running it. If any errors are present, the build will fail and the application will not run. If the Deploy On Run option has been selected, the application will be automatically deployed after it has been successfully built, but before it is run. If there are any errors during deployment, or if the deployment is cancelled, then the application will not run.
Client applications:
Server applications:
You can also use the keyboard to run an application by pressing the F9 key.
Both before and while running a server application in the IDE, you can define source unit breakpoints so that the application execute will pause when it hits such a breakpoint. Breakpoints can be added by clicking to the left of the line numbers in the gutter area of the code editor:
You can also toggle a breakpoint for the current line in the code editor by pressing the F5 key.
Once a breakpoint has been set, it is added to the breakpoints:
You can navigate to a breakpoint by double-clicking on the breakpoint or by pressing the Enter key when the breakpoint is selected. In order to delete, enable, or disable a given breakpoint, you can use the breakpoints toolbar or you can right-click on the breakpoint and select the desired option from the context menu. You can also delete a breakpoint by selecting the breakpoint and pressing the Del key.
Once a server application has been successfully started on the run server, the interactive debugging functionality will become active in the IDE. If any breakpoints were set in the source units for the project, these breakpoints will be updated to reflect whether they are valid for the compiled application present on the run server. If any valid breakpoints are encountered while the application is being executed on the run server, the application execution will pause and various debugger command buttons will be enabled.
Debugger Commands
Click on the Step Over button to step over the current source unit line being executed, even if the line contains a function or procedure call. You can also use the keyboard to step over a source unit line by pressing the F8 key.
Click on the Step Into button to step over the current source unit line being executed if the line does not contain a function or procedure call, or step into the corresponding function or procedure if the line does contain such a call. The debugger will step into the first call followed by any other calls on the same line, from left to right. You can also use the keyboard to step over a source unit line by pressing the F7 key.
Click on the Step Out button to step out of the current procedure or function body. You can also use the keyboard to step out of a procedure or function body by holding down the Shift key and pressing the F7 key.
Click on the Resume Application button to resume execution of the application. The application execution will then continue until it either hits another breakpoint, is stopped, or completes. You can also use the keyboard to resume execution by pressing the F9 key.
Click on the Stop Application button to stop the execution of the application. You can also use the keyboard to stop the execution by holding down the Ctrl key and pressing the F2 key.
Whenever the execution of the application is paused, you will also see two new tabs appear in the Tools area of the IDE: the call stack and the local variable inspector.
Call Stack
The call stack will show all of the calls that preceded the current breakpoint, in the reverse order of when the call was executed:
The call stack allows you to navigate to a call by double-clicking on the call or by pressing the Enter key when the call is selected. In order to toggle a breakpoint for a given call, you can use the call stack toolbar or you can right-click on the call and select the Toggle Breakpoint option from the context menu.
Local Variable Inspector
The local variable inspector allows you to examine the value of any local variables, including the properties of class instances.
This web page was last updated on Tuesday, September 16, 2025 at 04:56 PM | Privacy Policy © 2026 Elevate Software, Inc. All Rights Reserved Questions or comments ? |
